Profiling C++ Code
Recently I used profiling on some C++ libraries I wrote for use with "OpenFOAM®":http://www.openfoam.org. Profiling allows you to see how much time your program spends inside each function. Using this, within half an hour I managed to reduce the cpu time of the code by around 70%. The offending code was calculating an integral, which contained many uses of the pow() function. The cpu time was easily reduced by precalculating some of these outside the integral and using sqr(x) instead of pow(x,2).
You can use gprof, but all the code needs to be recompiled using the -pg option. Instead you can use Cachegrind or Callgrind which don't require your code to be recompiled. The disadvantage is that they cause the code to run slower.
I used "Callgrind":http://valgrind.org/docs/manual/cl-manual.html, a tool that is part of "Valgrind":http://valgrind.org. It's executed using:
valgrind --tool=callgrind <executableName>
kcachegrind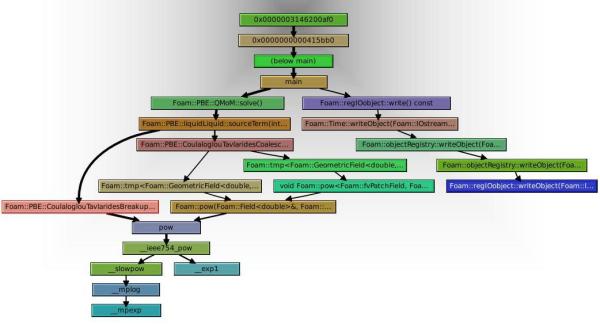
blog comments powered by Disqus
